������Ҫ���ܾ���ͨ�������ķ�ʽ����������cpu��ʹ��������С�����ͨ����������Ľ�������ǿ��ԶԳ����и����������õ�����֮��ĵ��ù�ϵ����ʱ���һĿ��Ȼ���ڶԳ����������Ż���ʱ������Ǻ���Ҫ�ģ��Ȱ����ʱ�����ɸ������Ż��ã������������������Ӧ��ʮ�����ԣ���Ҳ���������Ż���һ����Ϊ������ԭ�����Ż����ʱ�ġ�
1����ô��װ��
1������gperftools
Wget https://code.google.com/p/gperftools/downloads/detail?name=gperftools-2.0.tar.gz
2��tar �Cxzf gperftools-2.0.tar.gz
3��cd gperftools-2.0
4��./configure --prefix=/usr/local �Cenable-frame-pointers
5��make && make install
ps������ʱ���� �Cenable-frame-pointers ����Ҫ���Եij����ڱ���ʱҪ����gcc����ѡ�����ijЩ���̳߳�����ܻ� core:
CCFLAGS=-fno-omit-frame-pointer
ps��perftools��2.4�ں˵Ķ��߳�֧�ֲ��Ǻܺã�ֻ�ܷ������̣߳�����2.6�ں˽����������⡣
��װͼ�λ���������kcachegrind��
kcachegrind��������������profiling�ļ���linux������ʹ�á�
kcachegrind install��sudo apt-get install kcachegrind
2��Google perftools��ô�õģ�
���������֣�
1��ֱ�ӵ����ṩ��api�����ַ�ʽ�Ƚ������ڶ��ڳ����ij���ֲ����������������ֱ����Ҫ�������ľֲ�������ص�api���ɡ�
��ʽ�����ú�����ProfilerStart() and ProfilerStop()
2�����Ӿ�̬�⣺���ַ�ʽ����Ϊ���õķ�ʽ�����������ϸ�Ľ��ܡ�
��ʽ���ڴ���link���������Ӳ��� �Clprofiler
For example��gcc [��] -o helloworld �Clprofiler
�����env CPUPROFILE=./helloworld.prof ./helloworld
ָ��Ҫprofile�ij���Ϊhelloworld������ָ�������ķ�������ļ���·��Ϊ./helloworld.prof
3�����Ӷ�̬�⣺���ַ�ʽ�;�̬��ķ�ʽ��࣬��ͨ�����Ƽ�ʹ�ã�����ʹ���߲��������һ����̬�⣨��Ϊ���Ӿ�̬�������binary�Ĵ�С������������Կ���ʹ�����ַ�ʽ��
��ʽ������ʱʹ��LD_PRELOAD��e.g. % env LD_PRELOAD="/usr/lib/libprofiler.so" <binary>�����Ƽ����ַ�ʽ����
Ps��env��linux�²��뻷��������shell����
4�� �鿴�ռ����ݽ��
�鿴profile�����pprof���ߣ�����һ��perl�Ľű���ͨ��������ߣ����Խ�google-perftool�������������ø�Ϊֱ�ۣ����ΪͼƬ��pdf�ȸ�ʽ��
Ps����ʹ��pprof֮ǰ��Ҫ�Ȱ�װ����per15�����Ҫ����ͼ���������Ҫ��װdot�������Ҫ--gvģʽ���������Ҫ��װgv��
����pprof���������ļ���
% pprof /bin/ls ls.prof
Enters "interactive" mode
% pprof --text /bin/ls ls.prof
Outputs one line per procedure
% pprof --gv /bin/ls ls.prof
Displays annotated call-graph via 'gv'
% pprof --gv --focus=Mutex /bin/ls ls.prof
Restricts to code paths including a .*Mutex.* entry
% pprof --gv --focus=Mutex --ignore=string /bin/ls ls.prof
Code paths including Mutex but not string
% pprof --list=getdir /bin/ls ls.prof
(Per-line) annotated source listing for getdir()
% pprof --disasm=getdir /bin/ls ls.prof
(Per-PC) annotated disassembly for getdir()
% pprof --text localhost:1234
Outputs one line per procedure for localhost:1234
% pprof --callgrind /bin/ls ls.prof
Outputs the call information in callgrind format
����callgrind�������
ʹ��kcachegrind��������.callgrind������з���
e.g. % pprof --callgrind /bin/ls ls.prof > ls.callgrind
% kcachegrind ls.callgrind
3����������
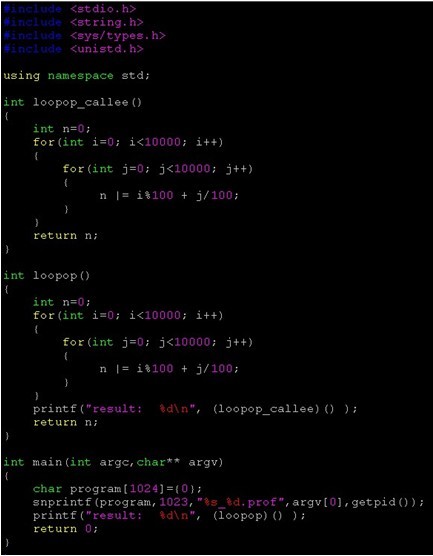
����һ��cpu_profiler_example.cpp���ڴ����в����ǩ���������ij�����������ض���profile
�������£�

��ע����������ProfilerStart() and ProfilerStop()
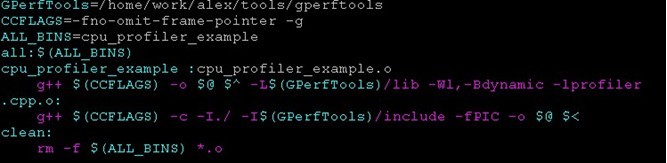
Makefile��
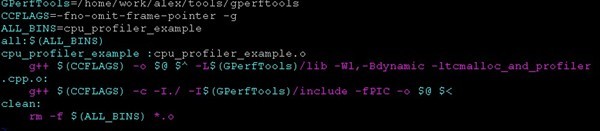
-L ��̬���ӿ��ַ�������п��ܳ���ִ�е�ʱ���Ҳ�����̬���ӿ⣬���Ե�
export LD_LIBRARY_PATH=LD_LIBRARY_PATH:"/home/work/alex/tools/gperftools/lib"
1��ִ��./cpu_profile_example

����һ�����������ļ�: cpu_profiler_example_29502.prof
Ps����Ȼָ�����������ļ����ɵ�·�����ļ�����
CPUPROFILE=/tmp/profile ./myprogram
����/tmpĿ¼�²���profile���������ļ�
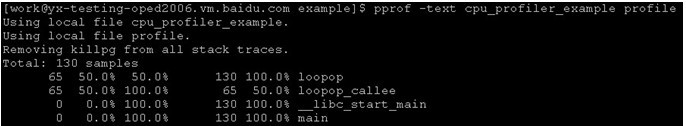
2��������������
pprof -text cpu_profiler_example cpu_profiler_example_3875.prof
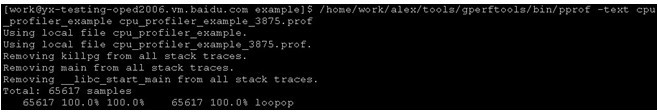
Text������������
14 2.1% 17.2% 58 8.7% std::_Rb_tree::find
�������£�
14��find����������14��profiling samples
2.1%��find�������ѵ�profiling samplesռ�ܵ�profiling samples�ı���
17.2%����find����Ϊֹ���Ѿ����еĺ���ռ�ܵ�profiling samples�ı���
58��find��������find������ı��������ܹ����ѵ�profiling samples
8.7%��find��������find������ı��������ܹ����ѵ�profiling samplesռ�ܵ�profiling samples�ı���
std::_Rb_tree::find����ʾprofile�ĺ���
ps�� 100 samples a second�����Եó��Ľ������100�����뵥λ
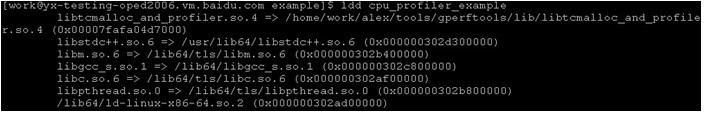
Ldd���Բ鿴һ������Ҫ������Щ��̬�⣺
��������cpu_profiler_example.cpp������Ҫ�ڴ����������κα�ǩ����profile���еĺ�����
�������£�
Makefile��
1��ִ�г����������������ļ�
CPUPROFILE=/tmp/profile ./cpu_profiler_example
2�����������ļ�
1��pprof -text cpu_profiler_example profile
2�������н���ģʽ

���������������ǵij����п����Ƿ��������������Զ�ִ�����˳��������ctrl+c�˳�Ҳ����������exit(0)�ķ�ʽ�˳�������ᵼ��������profile��ʱ���ռ��������ݲ�ȫ�����ǿյģ��������½���취��
��ProfilerStart��ProfilerStop��2��������װ�������źŴ��������У�����������ź�SIGUSR1���Ϳ�ʼprofile������������ź�SIGUSR2����ֹͣprofile���������ǿ�����ʱ�Գ������profiling����������ݡ�
�������£�
 1 #include <stdio.h>
 2 #include <sys/types.h>
 3 #include <unistd.h>
 4 #include <signal.h>
 5 #include <google/profiler.h>
 6
 7 //SIGUSR1: start profiling
 8 //SIGUSR2: stop profiling
 9
10 static void gprof_callback(int signum)
11 {
12     if (signum == SIGUSR1)
13     {
14         printf("Catch the signal ProfilerStart\n");
15         ProfilerStart("bs.prof");
16     }
17     else if (signum == SIGUSR2)
18     {
19         printf("Catch the signal ProfilerStop\n");
20         ProfilerStop();
21     }
22 }
23
24 static void setup_signal()
25 {
26     struct sigaction profstat;
27     profstat.sa_handler = gprof_callback;
28     profstat.sa_flags = 0;
29     sigemptyset(&profstat.sa_mask);
30     sigaddset(&profstat.sa_mask, SIGUSR1);
31     sigaddset(&profstat.sa_mask, SIGUSR2);
32
33     if ( sigaction(SIGUSR1, &profstat,NULL) < 0 )
34     {
35         fprintf(stderr, "Fail to connect signal SIGUSR1 with start profiling");
36     }
37     if ( sigaction(SIGUSR2, &profstat,NULL) < 0 )
38     {
39         fprintf(stderr, "Fail to connect signal SIGUSR2 with stop profiling");
40     }
41 }
42
43 int loopop_callee()
44 {
45     int n=0;
46     for(int i=0; i<10000; i++)
47     {
48         for(int j=0; j<10000; j++)
49         {
50              n |= i%100 + j/100;
51         }
52     }
53     return n;
54 }
55
56 int loopop()
57 {
58     int n=0;
59     while(1)
60     {
61         for(int i=0; i<10000; i++)
62         {
63             for(int j=0; j<10000; j++)
64             {
65                 n |= i%100 + j/100;
66             }
67         }
68         printf("result:  %d\n", (loopop_callee)() );
69     }
70     return n;
71 }
72
73 int main(int argc,char** argv)
74 {
75     char program[1024]={0};
76     //snprintf(program,1023,"%s_%d.prof",argv[0],getpid());
77     setup_signal();
78     printf("result:  %d\n", (loopop)() );
79     return 0;
80 }��ע��������gprof_callback��setup_signal��
���������Բ���kill -s SIGUSR1 5722��kill -s SIGUSR2 5722����ʼ�ɼ���ֹͣ�ɼ���5722�ǽ���pid��
4���ĵ�
�����һ�㣬Ҫ��google-perftool�����������뱣֤�����������˳���
����kcachegrind�鿴����֮����������������������
 ϲ��
ϲ��  ��
�� �ѹ�
�ѹ� ��
�� ��
�� ����
����